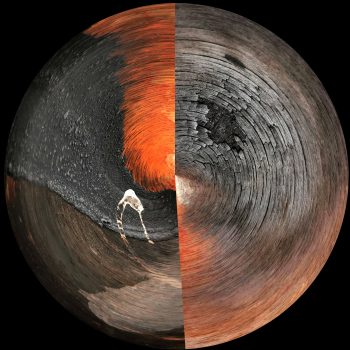
Tell us about the evolution of your concept through this creative development process.
Risk = Hazard X Exposure X Vulnerability
Scott previously worked on a project called ‘Blueprint for a Resilient South East NSW’. This project is to assist 11 councils and their communities to progress on their resilience journeys in the face of increased chance of impacts from natural disasters due to climate change.
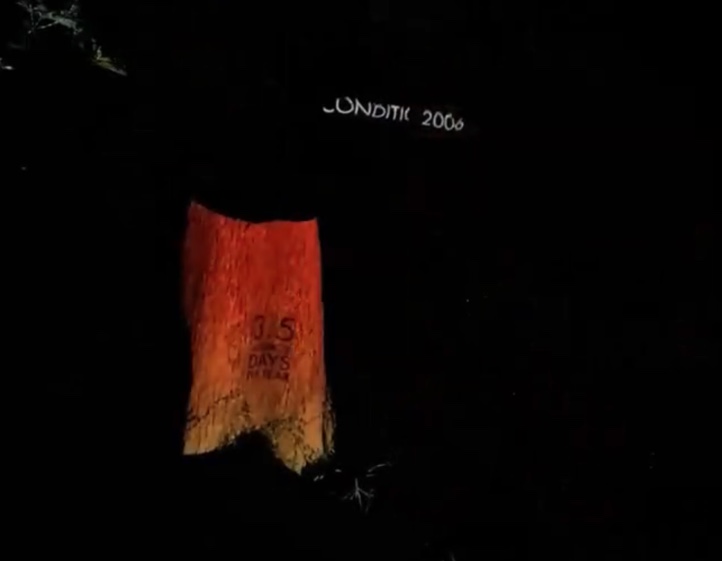
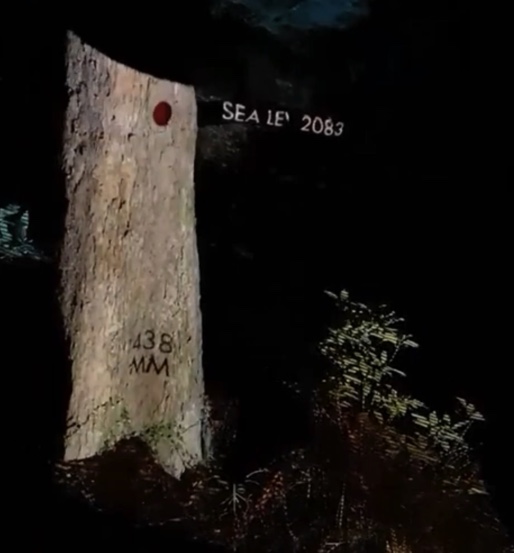
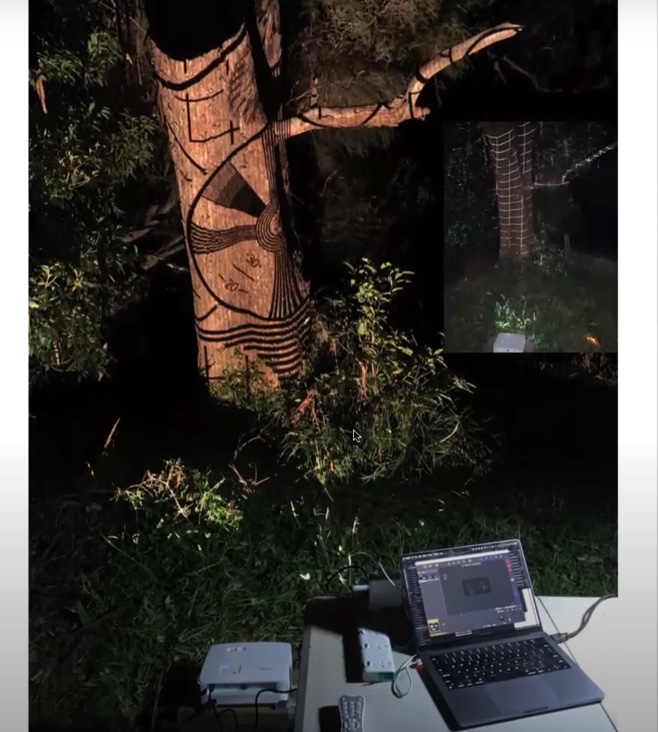
One of the aspects of this project is to support councils and communities to understand their risks through presenting climate change data for each local government area. The opportunity to explore a vision of the future in this region and access to these data sets provided an obvious nexus with my interest in video projection mapping.
Conceptual Development
Starting with a spreadsheet of four sets of data – sea level rise, hot days (above 35), dangerous fire condition days and Forest Fire Danger Index (FFDI), I had to prioritise which sets to focus on even though there was the intention of developing all four. I chose sea level rise and dangerous fire condition days.
